BibTexViz is a tool that transforms .bib files into interactive visualizations for exploring and analyzing research productivity. It offers an intuitive overview of the research publication landscape over the years, allowing users to quickly identify the most significant publications and understand their context.
This web application runs entirely on the client side, requiring no server, and leverages HTML, CSS, JavaScript, and the D3.js library to render the visualizations.
Researcher information
The input form contains two fields:-
Researcher (required): The researcher's full name. It is used to search for the researcher in the DBLP database and retrieve all their BibTeX entries.
It is also used to determine the author's position among the total number of authors in each publication.
Note that DBLP may not list all publications or may contain incomplete BibTeX entries, so providing a
.bibfile can help fill in any missing information and improve the visualization. -
.bib file (optional): The provided
.bibfile is used to extract the researcher's publications. If this field is not provided, publications are retrieved from DBLP. If both sources are provided, the.bibfile takes precedence over DBLP, allowing you to customize entries and include additional information not available in DBLP.
Visualization of a publication
Publications are shown as colored squares in a bar chart timeline. Each bar represents a year, with all publications for that year stacked vertically. Within a year, publications are ordered from top to bottom by type, ranking, awards, and date, in that order of precedence. The type order is specified in the following section. Each square is interactive, allowing you to click and view publication details such as title, authors, DOI, and more.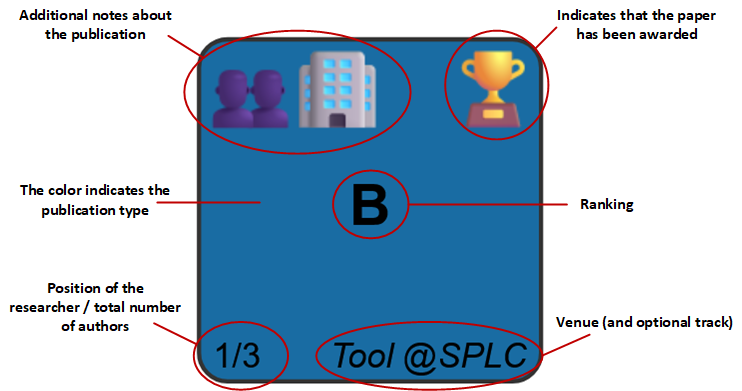
Publication type
The type of a publication is automatically extracted from the BibTeX entry and encoded with colors following a schema similar to that used by DBLP.
@book or @phdthesis
@article
@inproceedings
@inproceedings with the Workshop or WS word in the booktitle
@inproceedings, requires scope={national} in the entry (not present in DBLP)
@misc with publisher={Zenodo}
@proceedings
@article with journal={CoRR}, @techreport, @misc, etc.
Ranking
-
Journals: The ranking is based on the Journal Citation Reports (JCR), which indicate their quartile (Q1 to Q4).
Since there is currently no free public API for JCR, this information cannot be obtained automatically. It must be manually added to the BibTeX entry, for example:
jcr={Q1}. More detailed information can also be included and will be shown in the publication details, e.g.,jcr={Q1 (9/131) Computer Science, Software Engineering. Impact factor: 6.5}, as long as it starts with the quartile. Non-indexed journals are indicated asjcr={}and appear in the visualization with a-, while if thejcrfield is missing, the ranking is considered unknown and shown as?. -
Conferences: The ranking is based on the ICORE ranking, which classifies conferences from A* to C.
This information is automatically extracted from the .csv file provided on the ICORE portal.
Non-indexed conferences are displayed with a
-in the visualization. -
Others: Other publications are not ranked by default and appear with a
-in the visualization. However, you can specify their ranking using acalificationBibTex entry. For example, to indicate the rating of a PhD thesis, usecalification={Cum Laude}, which will display "Cum Laude" as its ranking in the visualization.
Venue
The venue of a publication is automatically extracted from the BibTeX entry and displayed at the bottom-right corner of the square. Its value depends on the publication type:
-
Journals: Taken from the
journalfield. -
Conferences: Taken from the
booktitlefield. -
Books and PhDThesis: Displays
BookorPhD Thesis, respectively. -
Others: Taken from the
journalorbooktitlefield.
journal or booktitle field has fewer than 25 characters, it is shown as is. Otherwise, an acronym within that field, usually enclosed in parentheses, is searched and used. If no explicit acronym is found, one is generated automatically.
Additionally, if you want to include more details, such as the conference track name or whether it is a short paper, you can use the track field.
Authors
At the bottom-left corner of the square, both the researcher's position and the total number of authors are displayed. If the researcher's name is not found in the author field, only the total number of authors is shown.
Awards
Awards are extracted from the awards field, where you can list any number of awards separated by commas. In the visualization, three types of awards are distinguished:
- 🏆 Best paper awards: For conference publications.
- 🏅 Other awards: For books and PhD theses.
- 🥈 Runner-up awards: For all types of publications.
awards={Best Paper Award, Best Presentation Award}. In this case, two 🏆 icons will appear in the visualization.
Runner-ups are identified by looking for keywords such as "runner-up", "runner up", "second best paper", "second award", "second prize", "third prize", "third best paper", or "honorable mention", in the award names.
Special issues
Information about special issue of journals can be added using the specialissue field.
specialissue={Special Issue on Data Visualization for Research}.
Additional notes
Additional notes about the publications can be added using the note field, where multiple notes can be listed, separated by commas. The following values are supported:
-
👥
external collaboration: Indicates that at least one co-author belongs to a different institution than the researcher. -
🏢
industry collaboration: Indicates that at least one co-author is affiliated with a company. -
🗺️
international stay result: Indicates that the publication is the outcome of an international research stay or internship carried out by the researcher.
note={external collaboration, industry collaboration}. In this case, the icons 👥🏢 will appear in the visualization.
Contact
For questions, feedback, or bug reports, you can contact José Miguel Horcas by email or open an issue on GitHub.
📧 Email 🐙 GitHub Issues